ORYNT
The Method What we measure ORYNT Performance Pricing Get the Free Scorecard
Practice intelligence · Executive systems

Your practice isn’t short on data.

It’s short on clarity.

ORYNT builds executive performance systems that turn monthly financial, operational, and workforce data into management priorities — so independent practice leaders can see what changed, why it changed, and what to do next.

Get the Free Scorecard See ORYNT Performance
The ORYNT Method

A repeatable monthly loop, not another report.

Four steps that take a practice from raw numbers to a decision you can hold someone accountable for.

01

SEE

Understand where the practice stands.

02

IDENTIFY

Find what’s changing and what deserves attention.

03

ACT

Turn performance signals into management priorities.

04

REVIEW

Measure whether the decision worked.

Three areas

Financial, People, Operations — read together, every month.

FINANCIAL

Know what’s actually driving performance.

Revenue
Margin
Collections
A/R
Labor cost
Forecast

PEOPLE

Understand the cost and capacity of your team.

Payroll
Overtime
Provider productivity
Staffing

OPERATIONS

See where the practice is losing capacity.

Scheduling
Utilization
No-shows
Revenue per visit
The product

Meet ORYNT Performance

Executive practice intelligence without another complicated software implementation.
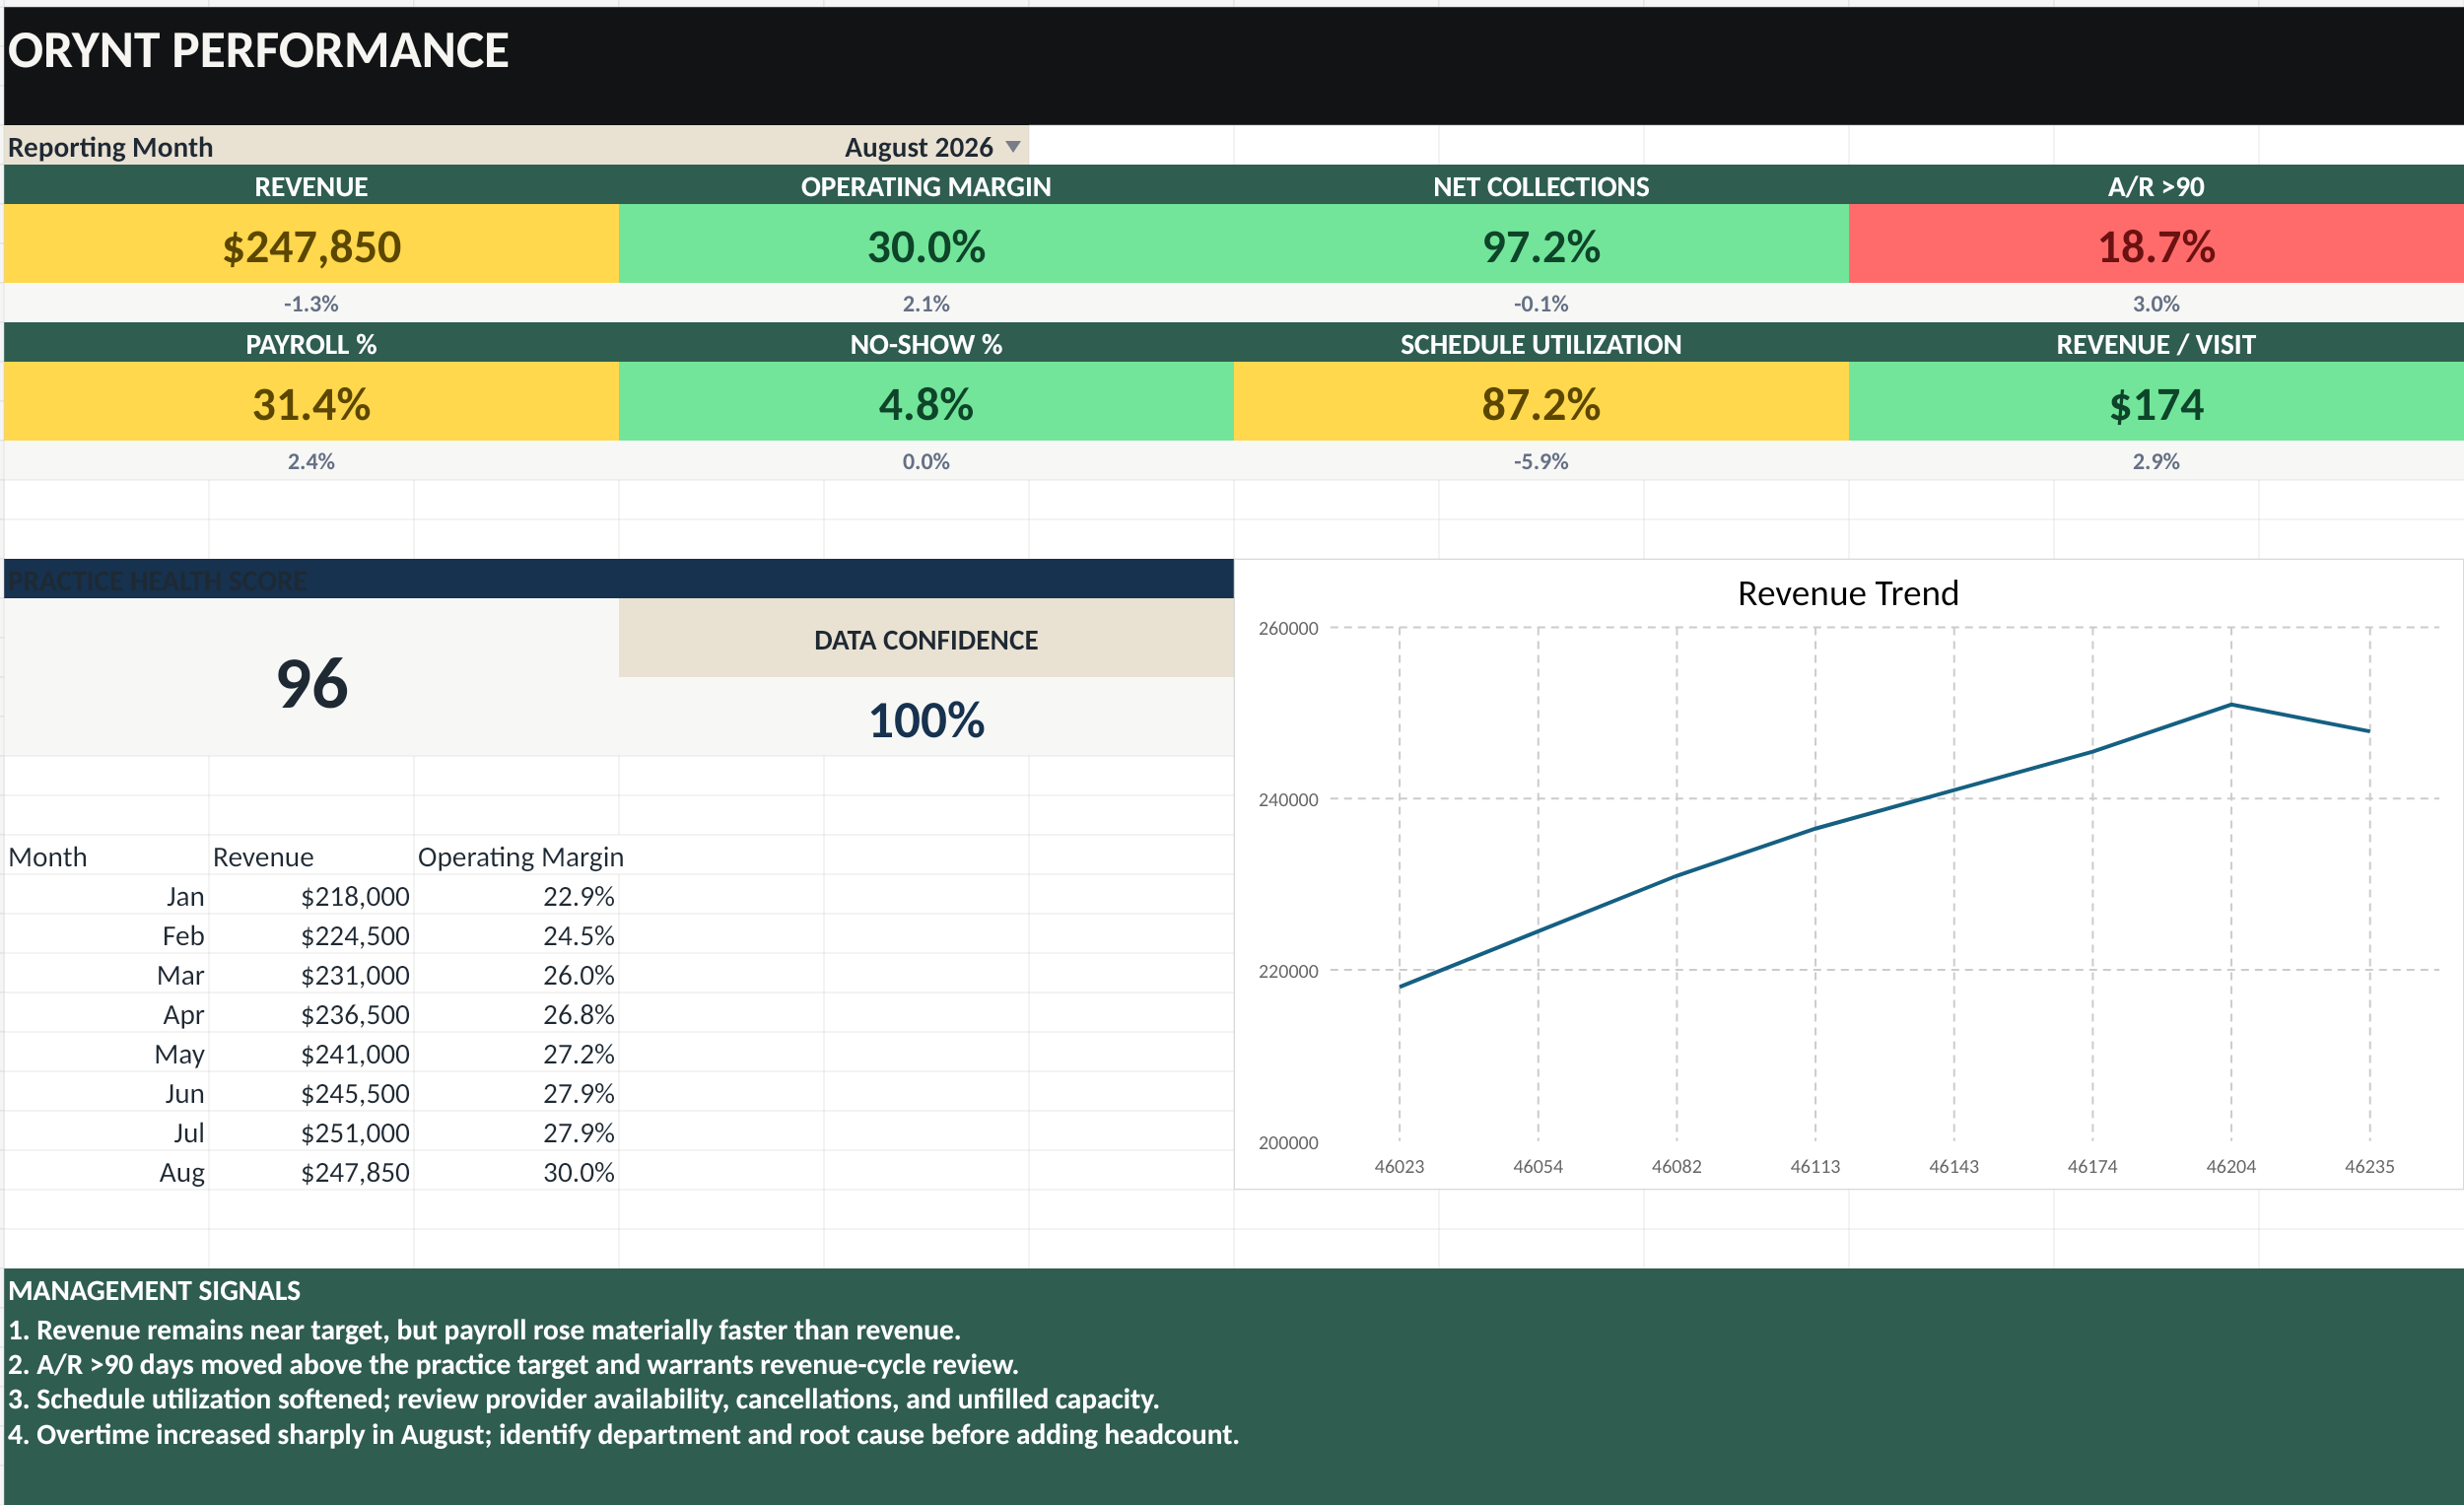
ORYNT Performance view
CEO Dashboard — ORYNT Performance
CEO Dashboard

See the practice at a glance.

Practice Health Score

Understand overall performance.

Executive Intelligence

Know what deserves attention.

Annual Executive View

See trends over time.

Budget + Forecast

Compare performance to plan.

Action Tracker

Turn signals into accountable priorities.

Inside the system

A sample month, read the way a CEO reads it.

Sixteen linked tabs, one monthly loop. Enter aggregate practice data once; the dashboard, the signals, and the review agenda build themselves.

ORYNT PERFORMANCE
Executive Practice Performance System · Know your numbers. Know what needs attention.
Reporting month
August 2026
Revenue
$247,850
−1.3% vs. prior month
Operating margin
30.0%
+2.1 pts
Net collections
97.2%
−0.1 pts
A/R > 90 days
18.7%
+3.0 pts · above target
Payroll %
31.4%
+2.4 pts
No-show %
4.8%
No change
Schedule utilization
87.2%
−5.9 pts
Revenue / visit
$173.93
+2.9%
96
Practice health score
Strong, with two watch items
Data confidence 100% — all inputs complete
Revenue & margin · Jan–Aug 2026
Revenue Operating margin
Management signals
1.

Revenue remains near target, but payroll rose materially faster than revenue.

2.

A/R over 90 days moved above the practice target and warrants revenue-cycle review.

3.

Schedule utilization softened; review provider availability, cancellations, and unfilled capacity.

4.

Overtime increased sharply in August; identify department and root cause before adding headcount.
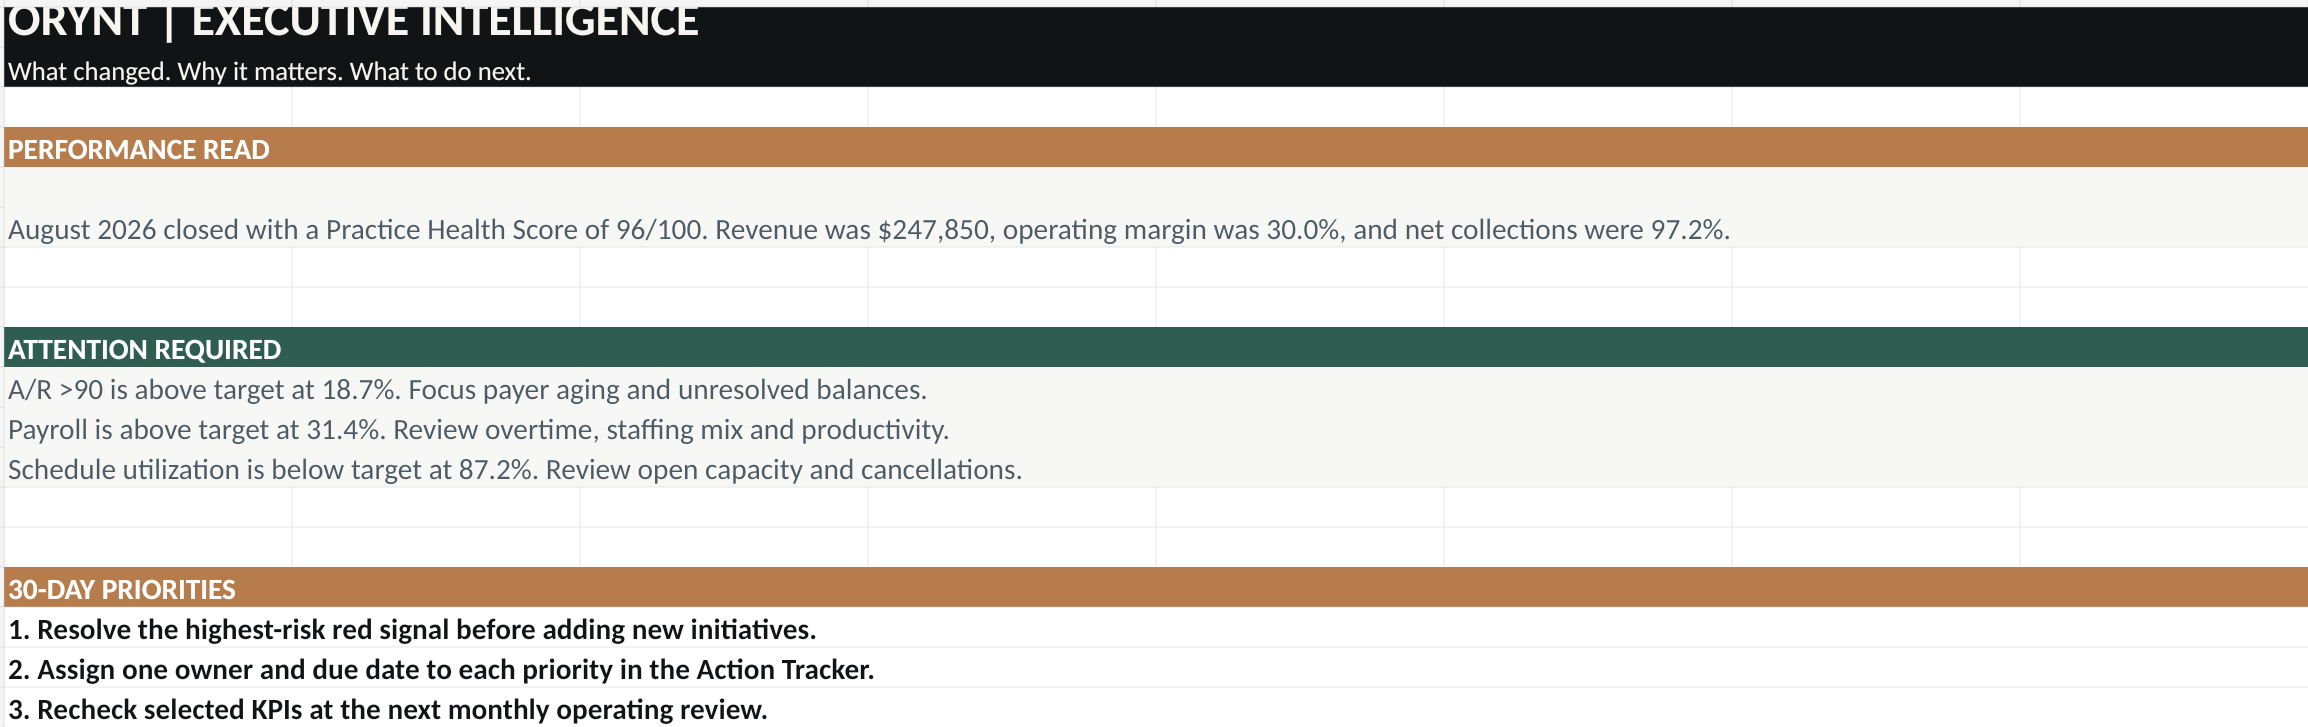
Executive Intelligence
ORYNT Performance view

What changed. Why it matters. What to do next — a written performance read, the items requiring attention, and three 30-day priorities.

The monthly read, in the leader’s words

“August 2026 closed with a Practice Health Score of 96/100. Revenue was $247,850, operating margin was 30.0%, and net collections were 97.2%.”

Attention required

A/R >90 is above target at 18.7%. Focus payer aging and unresolved balances.

Payroll is above target at 31.4%. Review overtime, staffing mix and productivity.

Schedule utilization is below target at 87.2%. Review open capacity and cancellations.

30-day priorities

1. Resolve the highest-risk red signal before adding new initiatives.

2. Assign one owner and due date to each priority in the Action Tracker.

3. Recheck selected KPIs at the next monthly operating review.

ORYNT Start Here Quick Start CEO Dashboard Monthly Input Setup & Targets What Changed Provider Scorecards Department Scorecards Budget & Forecast Annual Executive View CEO Review KPI Dictionary
Sample figures shown. Aggregate practice-level data only — no patient-identifiable information is ever entered.
Built differently

Built from inside the practice.

ORYNT wasn’t created from a theory about how independent practices should operate.

It was built from two decades of healthcare administration and executive leadership — COO and CEO roles across ambulatory surgery centers and private multi-specialty practice — and from the questions practice leaders actually have to answer every month.

Laina Roberts
Former COO and CEO · ASC and private multi-specialty practice
01 What’s changing?
02 What’s driving it?
03 What deserves attention?
04 What should we do next?
Free executive resource

7 Numbers Every Practice Leader Should Know

The ORYNT Practice Performance Scorecard

A practical executive scorecard for evaluating financial and operational performance in an independent practice.

Revenue Margin Collections A/R > 90 Payroll % Utilization Revenue / visit
Send me the scorecard

Free, no obligation. You’ll also get early access as new ORYNT systems are released.

We never ask for patient data. Unsubscribe any time.

Available now

ORYNT Performance

FOUNDING EDITION

Includes the full performance system plus every future V1 update. Founding buyers help shape what ships next — your feedback goes straight into the roadmap.

Sixteen linked tabs, ready to use
CEO Dashboard, Health Score, and Management Signals
Budget & Forecast, Provider and Department Scorecards
Implementation guide and KPI Dictionary
$149 one-time

Includes the full performance system + future V1 updates.

Founding Edition · available now
GET THE FOUNDING EDITION

Secure checkout through Stripe. Instant download after payment. 14-day refund policy.

Meanwhile, get the free scorecard
ORYNT

Know where your practice stands.
Know where to go next.

Explore
Get the scorecard
Get the Free Scorecard
© 2026 ORYNT ORYNT systems use aggregate practice data only — never patient-identifiable information.